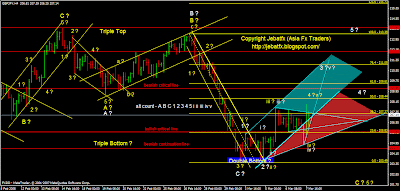
Chart 1H - I'm getting more bias towards my alt count. As long the price move in blue and red zones, the market is in bullish trend. A breakout to the short critical point and later to the major bullish reversal critical point would bolster this point of view. Unless the price break the lower red zone trendline, this idea would be invalid, means thats favourable back to Bearish Continuation. Otherwise preferable a Bullish Reversal Continuation. Please do the checklist and wait for a complete signal from BSTS before making any entry.

Chart 4H - I can see clearly that a retracement to complete wave iv still incomplete. As long the price move inside the blue and red zones, this speculations would still be valid. But if the price still continue to bullish and break my bearish critical line, I'm more favour for a bullish continuation already. Please take notes about my alt count. Otherwise if the price break the lower red zone trendline, preferable for a bearish continuation to complete wave C and 5.

No comments:
Post a Comment