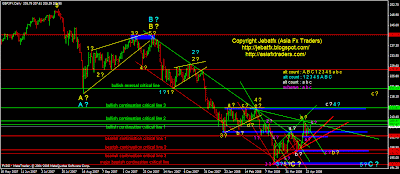
Chart 1H - Please study all the 3 possibility wave counts (yellow, white & magenta) and try to analyze which one is more preferable. If there is a bullish continuation, then we shall see either wave 5 is truncated (yellow) or an impulsive (white). Unless price break the retracement critical line which is favourable to magenta count, the bullish continuation scenario would still be valid.

Chart 4H - Unless there is a true breakout to the bullish continuation critical line 2, I believed most probably wave 5 will be a truncated wave scenario. Therefore please looking for a bearish reversal signal from BSTS later.

Chart Daily - Unless we see a true breakout to the upper lime trendline and later to the bullsih continuation critical line 2, I believed market preferably in magenta a b c counts to complete major wave b (yellow). Overall, last week daily pre market oveview chart forecast are still valid until this moment. Otherwise we may see a bullish continuation to complete wave c (white) and 4 (cyan) later.
Summary :-
Preferable, market in bullish continuation phase to complete wave 5 which is favourably a truncated wave..
Please looks for a bearish reversal signal from BSTS later once wave 5 is completed. Advisable to wait for a complete triggered BSTS signal before making any entry. Good luck.
No comments:
Post a Comment