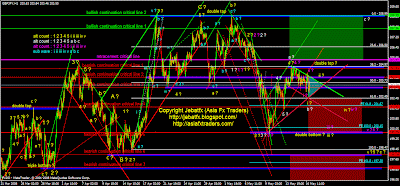
Chart 1H - At this moment, I believed wave4 already completed (yellow or magenta) and price in the process to perform wave 5 and C. A breakout to the lower red trendlines and later to the bearish continuation line 4 woulde bolster this scenario. Otherwise if my retracement critical line is taken, then this scenario would be invalid and shall more preferable to count in white.

Chart 4H - Please watch the teal triangle zones for any breakout.Preferable for a bearish continuation trend later as long my retracement critical line still intact. Anyway, please study all alternate counts and determine which counts is more favourable.

Chart Daily - Please analyse all alternate counts (yellow, white % magenta) and looks from BSTS any significant signal for any particular counts. As long the price stay under the upper green trendline, favourably the trend still bias for bearish trend.
Summary :
1) Please look for a bearish continuation signal fromn BSTS with condition the retracement critical line stay intact and alternate count in white is not valid.
2) Wave 5 could be a truncated wave or an impulsive wave.
3) Look for a bullish reversal signal once wave 5 is completed.
No comments:
Post a Comment